Point of Control [BigBeluga]🔵 OVERVIEW
Point of Control identifies the exact price level with the highest traded volume over a selected lookback period.
This level—called the Point of Control (PoC) —marks where the greatest market participation occurred, representing a zone of highest volume.
The indicator helps traders visualize dominant volume concentrations, fair-value levels, and structural balance within recent price action.
🔵 CONCEPTS
Point of Control (PoC) — The single price level within the defined lookback range that has accumulated the most traded volume.
Volume Distribution Bins — The price range is divided into 25 equal bins, and volume is aggregated per bin to locate the maximum concentration.
Range Boundaries — The highest and lowest price within the lookback window are used to form the upper and lower reference limits.
PoC Channel — Optional upper and lower bands plotted around the main PoC to visualize a fair-value corridor.
Volume Intensity Mapping — Candle color dynamically shifts based on the candle’s position relative to the PoC channel, showing whether price is balanced or trending away from high-volume levels.
🔵 FEATURES
Configurable Lookback Range — Adjust how many bars (10–400) are used for calculating the PoC.
Precise PoC Calculation — Volume aggregation across 25 bins to identify the exact volume peak.
Dynamic Channel Visualization — PoC bands above and below the central level to indicate equilibrium tolerance.
Adaptive Candle Coloring —
- Neutral → price inside PoC channel. Gray
- Bullish → price above PoC channel. Blue 🔵
- Bearish → price below PoC channel. Orange 🟠
Automatic Volume Labeling — Displays total volume at the active PoC level for quick reference.
Directional Indicators — 🔵 or 🟠 markers appear when price shifts above or below the PoC channel.
Range Visualization — Plots the highest and lowest points of the active lookback window for contextual awareness.
Live Updating Logic — PoC recalculates automatically every 15 bars for efficient chart performance and accuracy.
🔵 HOW TO USE
Volume Anchoring — Use PoC as a reference for where the majority of volume occurred; price often reacts to or consolidates around this level.
Trend Confirmation — Sustained price movement away from PoC channel may signal developing directional imbalance.
Value Tracking — Watch the shifting of PoC across time to identify where fair value migrates during market evolution.
Equilibrium Mapping — When price hovers around PoC, the market is balanced; when it departs, a new value zone may form.
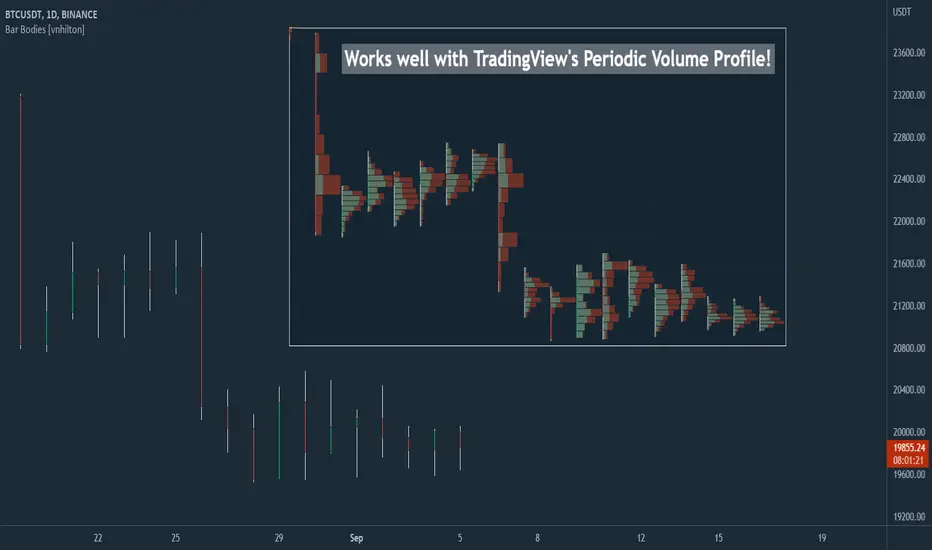
Combine With Volume Profiles — Use alongside profile tools for higher-resolution analysis of institutional activity.
🔵 CONCLUSION
Point of Control provides a pure, volume-centric view of market balance by pinpointing where most transactions occurred within any chosen range.
It delivers a clean and efficient visualization of fair value zones—helping traders track the heartbeat of market participation, recognize dominant liquidity areas, and stay aligned with where true market interest resides.
อินดิเคเตอร์ Pine Script®